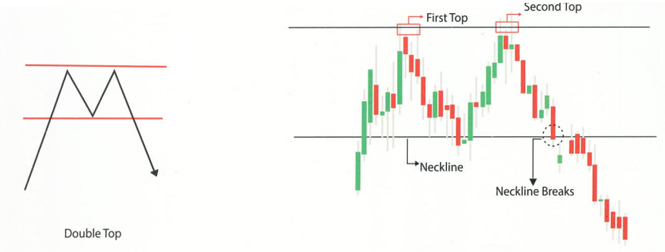
From this section, we are going to learn about the different stock market chart patterns like Double Top, Double Bottom Triple Top, and many others.
Double Top Pattern

A Double Top is like a warning signal for investors. It happens when something like a stock or cryptocurrency price hits a high two times in a row and with a little drop in between. When the price falls below a certain point it is called the support level, that’s when you should know that the double top is for real, and it suggests the price might keep going down.
Double Bottom Pattern

A Double Bottom is a super positive signal in trading. It happens when something like a stock hits a low price two times consecutively with a little bit of support in between. When the price goes above a certain level it is known as the resistance level, which is usually around the highest point between the two lows then it confirms that it is a double bottom pattern. This is seen as a strong signal that the price will keep going up.
Triple Top Pattern

A Triple Top pattern is a bad signal in trading. It happens when the stock price hits a high price three times in a row with a little drop in between each high. When the price falls below a certain level it is known as the support level, which is usually around the lowest point between the three highs then it confirms it is a triple top pattern. This suggests that the price might keep going down.


