In this section, we are going to learn about the Bullish Symmertrical Triangle, Bearish Symmertrical, Cup and Handle, and Inverted Cup and Handle Pattern.
Bullish Symmetrical Triangle Pattern

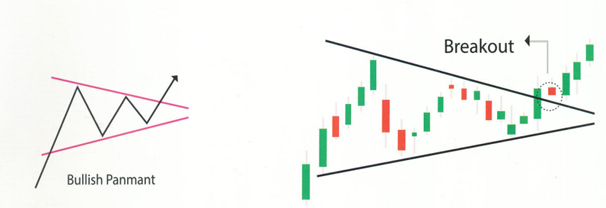
A bullish symmetrical triangle is a pattern on the chart that suggests the continuation of an upward trend. It forms when two trend lines converge symmetrically towards a horizontal line. The upper trend line acts as resistance, indicating a level where the price struggles to move higher. We confirm the breakout when the price moves above this resistance line and starts going up.
Bearish Symmetrical Triangle Pattern

A bearish symmetrical triangle is a pattern on a chart indicating a continuation of a downward trend. It’s formed by two converging trend lines that meet at a horizontal line. The lower trend line acts as support, suggesting a level where the price finds it hard to drop below. We confirm the breakout when the price falls below this support line and starts moving downward.
Cup and Handle Pattern

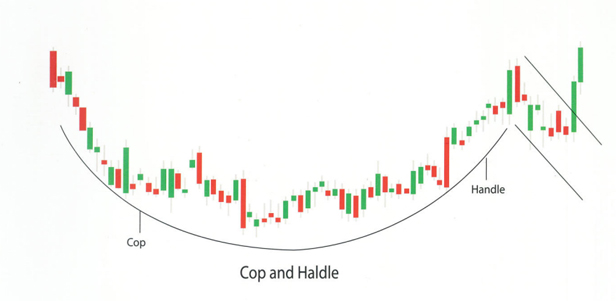
A cup and handle is a pattern that looks like a teacup followed by a downward movement resembling a handle. This handle is seen as a buying opportunity for the stock. We confirm the breakout when the price moves above a certain level called the neckline or resistance, indicating a potential upward movement.
Inverted Cup and Handle Pattern

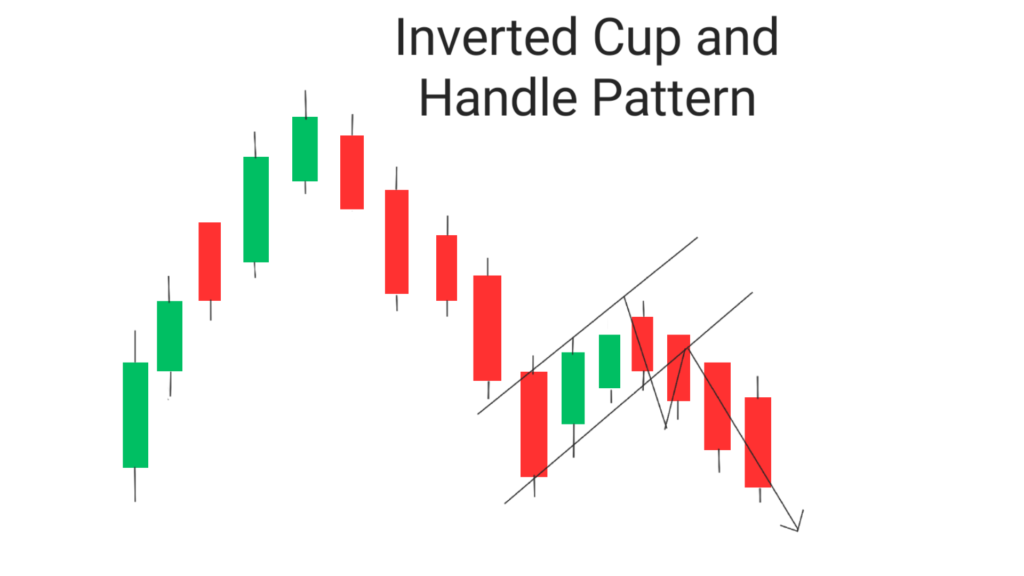
The inverted cup and handle pattern forms an upside-down cup and handle. The pattern is formed after a pullback from a swing low before a sell-off to the prior swing low and stalls due to underlying support. The stock then stalls much like a bear flag with slight upward pressure before breaking down below support.


