In this article, we are going to learn about Bullish Rectangle, Bearish Rectangle, Bullish Flag, and Bearish Flag Pattern.
Bullish Rectangle Pattern

The bullish rectangle is a pattern on the chart that happens when the price takes a break during a strong trend. It moves back and forth between two parallel lines for a while before the trend starts. We know the breakout is happening when the price breaks above a certain level and starts going up again.
Bearish Rectangle Pattern

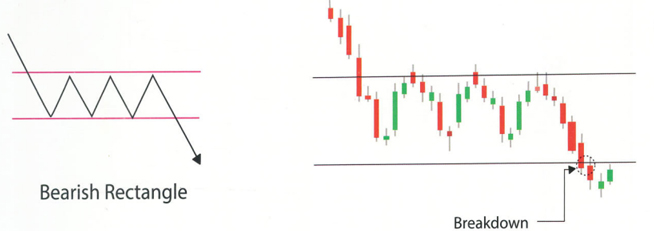
The bearish rectangle is a pattern on the chart that happens when the price takes a break during a strong downward trend. It moves back and forth between two parallel lines for a while before the trend continues downward. We confirm the breakout when the price breaks below a certain level and starts going down again.
Bullish Flag Pattern

Bullish flag formations are seen in stocks that are on a strong upward trend, and they’re seen as positive signs that the trend will continue. They’re called bull flags because they look like flags on a pole. The pole happens when the price shoots up quickly on the chart, and then the flag part comes from a period where it consolidates or holds steady. We confirm the breakout when the price moves above the top of the flag.
Bearish Flag Pattern

The bearish flag is the opposite of the bull flag. It looks the same but flipped upside down. It starts with a steep drop in price caused by a sudden rush of selling followed by a bounce where the price moves within parallel lines and forms the flag shape. We confirm the breakout when the price falls below the bottom trendline.


