Triple Bottom Pattern

A triple bottom is a good signal in trading. It happens when something a stock hits a low price three times in a row and with a little support in between each low. When the price goes above a certain level it is known as the resistance level, which is usually around the highest point between the three lows it confirms the triple bottom pattern. This suggests that the price might keep going up.
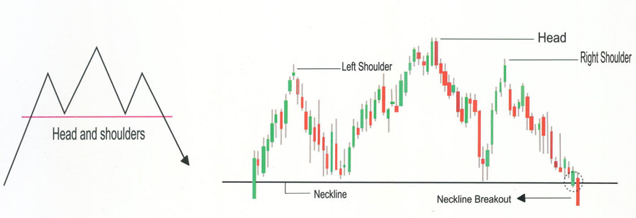
Head & Shoulder Pattern

A head and shoulders pattern is a shape on a chart that looks like three bumps. The two bumps on the outside are about the same height and the one in the middle is the tallest. When the price drops below a certain point it is called the support level and it confirms the pattern. It’s called “head and shoulders” because it kind of looks like a person’s head and shoulders on the chart.
Inverse Head & Shoulder Pattern

An inverse head and shoulders are like the flipped version of the regular head and shoulders pattern. It is used to predict when a downtrend might turn around and start going up. Instead of bumps, it looks like three dips on a chart. First, the price goes down to a low point, then it goes up a bit, then down again but not as much as before. When it goes up after the last dip and breaks a certain point it is called resistance, that’s a signal that the price might start going up for real.


